Ever feel like you have loads of digital marketing data, yet struggle to do anything meaningful with it? You’re not alone: The average marketer today is tracking leads that have multiple marketing touchpoints, so it can be challenging to determine what’s working and what’s not.
Analyzing user paths helps determine the typical steps taken before conversion, but it’s just the tip of the iceberg when it comes to assessing how well your marketing efforts are performing. If users tend to first land on your site via an ad, is it because they prefer to be reached by ads, or because they just like this specific ad’s content? On the flip side, if your ads don’t get much traction, is it because ads don’t work, or because your ad content doesn’t resonate?
To answer these kinds of questions and best measure marketing efficacy, you need to dissect each touchpoint for three features: Referring source, content, and CTA.
Referring sources: The economic data within a marketing touchpoint
Sources are essentially any marketing tactics you use to get in front of people. Most of the time these are the tactics that your marketing budget goes toward, so it’s important to track sources against spend and acquisition to ensure ROI. These can be both offline and online, but for the purpose of this post we’ll focus on the digital touchpoint.
Marketing Acquisition Cost (MAC)
There’s no right way to track spend, but calculating Marketing Acquisition Cost (MAC) is a simple way to get started. MAC is calculated by taking how much you spend on marketing efforts during a given time period and then dividing that figure by how many customers you acquired during the same time period.
MAC is customizable in that you choose what counts as marketing spend depending on how your company allocates budget. For example, here at CallRail we factor certain online trade association membership costs into our total MAC, but we do not include things like online newswire fees incurred when publishing a press release.
Here are some other costs to consider:
- Advertising spend on PPC, social media, display, etc.
- Virtual trade show and webinar sponsorships
- Sponsored directories
- Sponsored articles
- Syndicated content
- Fees for outsourcing partners (SEO, paid media, graphic designers, etc.)
How to calculate MAC
Once you’ve figured out what costs you want to include, you can get to calculating. We recommend you take a digital approach to this if possible. By utilizing Supermetrics, you can connect many advertising platforms in order to programmatically feed your digital data points into a Google spreadsheet, which you can then use to automatically calculate your MAC. This makes it easy to toggle by marketing tactic, date range, and more.
If you’re calculating MAC manually, collect your data, choose a time period or campaign, tally up how many new customers you’ve earned, divide total marketing costs by total leads, and voila—you have your MAC! Now, it’s time to compare your MAC to how much revenue you make from each customer.
For example, let’s say you run a dental office and want to use digital marketing to attract new patients. Your customer lifetime value is $3,000, and you need at least $2,500 per person to cover operating costs and make a profit. In this scenario, you should shoot for a MAC of $500 or less, depending on your budget.
You don’t need to compare MAC to customer lifetime value, however. For certain businesses and industries that thrive on smaller, one-time sales, it may be more practical to compare MAC to individual sales instead of customer lifetime value. You can then optimize user experience to get customers to buy more at once and make the most of your MAC.
Once you have your MAC, it’s time to figure out how to split the budget across various marketing channels. Looking at historical data can be a good place to start — if more site visitors touch ads than any other marketing effort, consider starting there. But looking at content types can also give you inspiration for marketing ideas that will resonate just as well on other channels.
Content types: The conceptual data within a marketing touchpoint
Think of content types as ideas or topics, not concrete tactics. You’re less concerned with how the topic was disseminated (ad, blog post, webinar, etc.), and more concerned with the topic itself. For trade shows, events, and webinars, in particular, it’s important to also keep tabs on the conversations you have with prospects. While the webinar topic itself is important (e.g. Transform Your Sales and Marketing with CallRail + HubSpot, individual conversations had over chat can provide extra insight.
It’s helpful to break content types up in two ways: Topic and funnel depth.
Topic
Topics will likely correspond with your service/product offerings, industry, target audience, and more. A hypothetical apartment management software company, Leasey, may have topics like this:
- Resident retention
- Resident acquisition
- Product tips
Funnel Depth
These will match up with the types of content people will need at various points in your sales funnel, from awareness building to consideration, conversion, and beyond.
Of course, funnel depths will overlap with topics. Creating a content matrix is an easy way to visualize this. For Leasey, a simplified version may look something like this:
Funnel stage
Awareness
Blog post: How Property Managers Can Use a CRM to Increase Retention
Sponsored content: How to Market Your Properties to Every Demographic
Blog Post: Leasey Releases Prospect Tracking Tool to Streamline Leasing Process
Engagement
Blog post: How Leasey’s Partner Program Makes Residents Happier
Whitepaper: How to Engage Prospective Residents with Leasey
Blog post: The Leasey Feature that Makes Property Managers’ Lives Easier
Conversion
Case study: ABC Apartments Increases Retention by 25% with Leasey
Video: How XYZ Multifamily Uses Leasey to Fill New Properties
E-book: How Leasey’s Prospect Tracking Tool Pays for Itself
Advocacy
Webinar: How to Respond to Resident Concerns with ABC Apartments and Leasey
Speaking session: Standing Out in Crowded Housing Markets with XYZ Multifamily and Leasey
User group: How to Get the Most Out of Leasey with 123 Apartments
You can flag pieces of content according to where they fall on this matrix, and then conduct an analysis to see what performs best. Google Analytics is the least expensive and perhaps easiest way to keep tabs on your content types. By enlisting the content groupings feature, you can turn your content matrix into a list you can drill down into. Here’s an example:
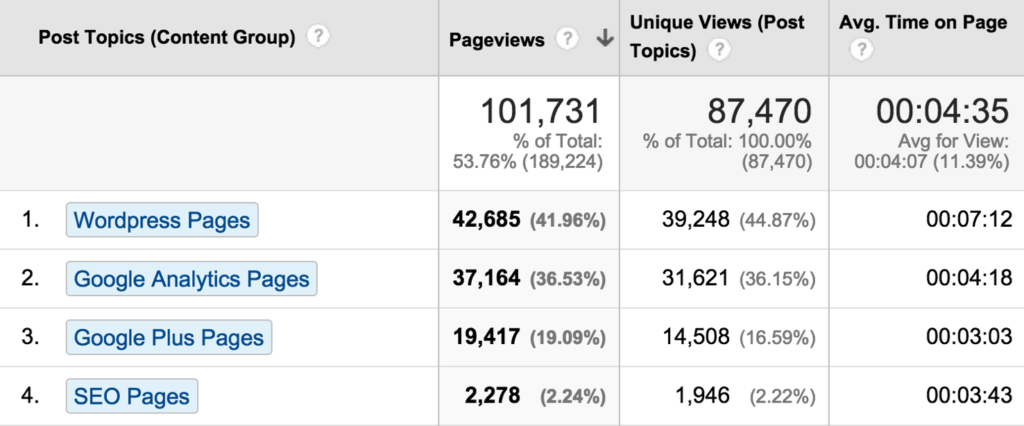
(source)
In this screenshot, we could assume that WordPress related content performs best since it has the highest number of pageviews, unique views, and average time on page.
Content grouping makes it easy to see which content types do best among your site visitors. Combine that with your referring source data, and you’ll have a holistic view of what your visitors want to hear about and how they want to hear it. All you need now are CTAs that convince them to convert.
CTAs: The conversion data within a marketing touchpoint
CTAs are your “talk to me” actions. They’re the parts of your marketing efforts that involve users offering their information in exchange for more information about your product or service. This could be a form submission for an ebook, coupon, sales demo, additional materials, free trial, or an inbound chat or phone call.
As with content types, you want to look at the CTAs designated for each stage of the funnel. In the awareness or engagement stage, this may be signing up for a free ebook, and in the conversion stage this could be signing up for a free trial or requesting a free consultation. In Google Analytics, you can track CTA conversions with custom goals, and toggle referring source to see which channels generate the most conversions.
That said, the referrer source only accounts for how a user first arrives on your site. This means that all credit for the conversion goes to that referrer source, while other touchpoints along the way don’t get credit. We won’t go into deciding an attribution model in this post for the sake of brevity, but it’s worth researching once you’ve gotten referring source, content, and CTA tracking down pat.
Advanced level tips: Segmentation
The three marketing touchpoint dimensions outlined in this post are a solid baseline for assessing your marketing efforts. But depending on your resources, you can use segmentation to derive even more value from your marketing data. The two most straightforward ways to do this are by segmenting your data by industry/vertical and touchpoint velocity.
Industry and vertical segmentation
If you work at a company with an established sales and marketing department, you probably have a good idea of which industries and verticals you need to target. By segmenting any of the three touchpoint dimensions by industry or vertical, you can get a better idea of which marketing channels, topics, and CTAs resonate best with your target markets.
For example, let’s say you work at a marketing agency and the main CTA on your website is a “contact us” form. Through industry segmentation, you find that nonprofits fill out the CTA form significantly less often than other industries. The solution may be as simple as tweaking the language of your CTA to optimize conversions.
It could be that budget-conscious nonprofits don’t like hard sells and would respond better to “schedule a free consultation” than they would “contact us”. It could also be that nonprofits need a lot more information before initiating the sales process. In this case, you could create and promote nonprofit-specific content to help them along their buyers’ journey.
Touchpoint velocity segmentation
Similarly to industry and vertical segmentation, touchpoint velocity segmentation gives you deep insight into your buyers journey. It enables you to not only see the time distance between the first touchpoint and ultimate conversion, but also see how many steps there were along the way. This is helpful for understanding and optimizing your conversion cycle, and for developing an attribution system that best reflects your buyer’s journey.
If you want to be really advanced, you can layer industry/vertical segmentation and velocity segmentation. It’s a useful way to craft tailored marketing campaigns that best resonate with specific audiences who may have different needs and buying habits.
At the end of the day, you define important marketing touchpoints based on what matters to your business, and you can make it as simple or as complicated as you’d like. No matter what your needs are, narrowing your analysis of digital marketing efforts to touchpoint metrics, starting with referring source, content, and CTA buckets, will filter out a lot of the noise in your heaps of marketing data.