


What are Phone Call Dashboards for Google Analytics and Google Data Studio?
Phone call dashboards for Google Analytics and Google Data Studio help you see the call data associated with your marketing campaigns in real-time. These types of dashboards include valuable metrics about your phone call leads such as the marketing source, the paid keywords used in search, the location of the caller, and the landing page the prospect was on when they placed the call. These dashboards can also tell you about the outcome about your phone calls with metrics such as missed call rate and duration of the call.
Why Marketers Need Phone Call Data in Google Analytics and Google Data Studio Dashboards
Many marketers are great at piecing together what happened to their leads online throughout the entire customer journey. Tools like Google Analytics are great at helping us measure what’s working and what’s not. But what happens when a prospect picks up the phone instead of ordering online? That’s where call tracking software comes in. Tools that give you visibility into call tracking metrics are invaluable for businesses that rely on phone call leads. Call tracking helps you understand where to best use your marketing spend by giving you full visibility into every lead driven by your marketing dollars.
But how do you measure these call tracking results? Very often, marketers are using several different tools to track their marketing efforts and gain valuable information about how their website is performing, be it call tracking and analytics tools, landing page builders, or an onsite chat tool. Many marketers don’t have the time to dive deeply into each of the tools in their marketing stack on a regular basis to see what is happening on their site. That’s where integrated Google Analytics and Google Data Studio dashboards come in.
By integrating these various tools with Google Analytics, marketers can create a quick and easy view of all of their high-level marketing metrics within a Google Analytics or Google Data Studio dashboard. These dashboards can be customized to fit any marketer’s needs and to help them keep track of the key performance indicators (KPIs) that are important to their business. This includes metrics such as:
- Form completions
- Online purchase completions
- A phone call from your site
- Onsite live chat initiations
- Downloading a document
- Signing up for an event, such as a webinar
By tracking these KPIs within Google Analytics or Google Data Studio, marketers can see how prospects are responding to their marketing campaigns and begin to optimize for these specific actions.
Most Useful Dashboards for Google Analytics and Google Data Studio
To maximize the value you’re gaining from Google Analytics or Google Data Studio dashboards, customization is always key. These reports allow you to view key metrics at a glance and tailor them to meet your needs. Here are a few examples of reports you can generate to begin better reporting inside of Google Analytics or with a Google Data Studio integration.
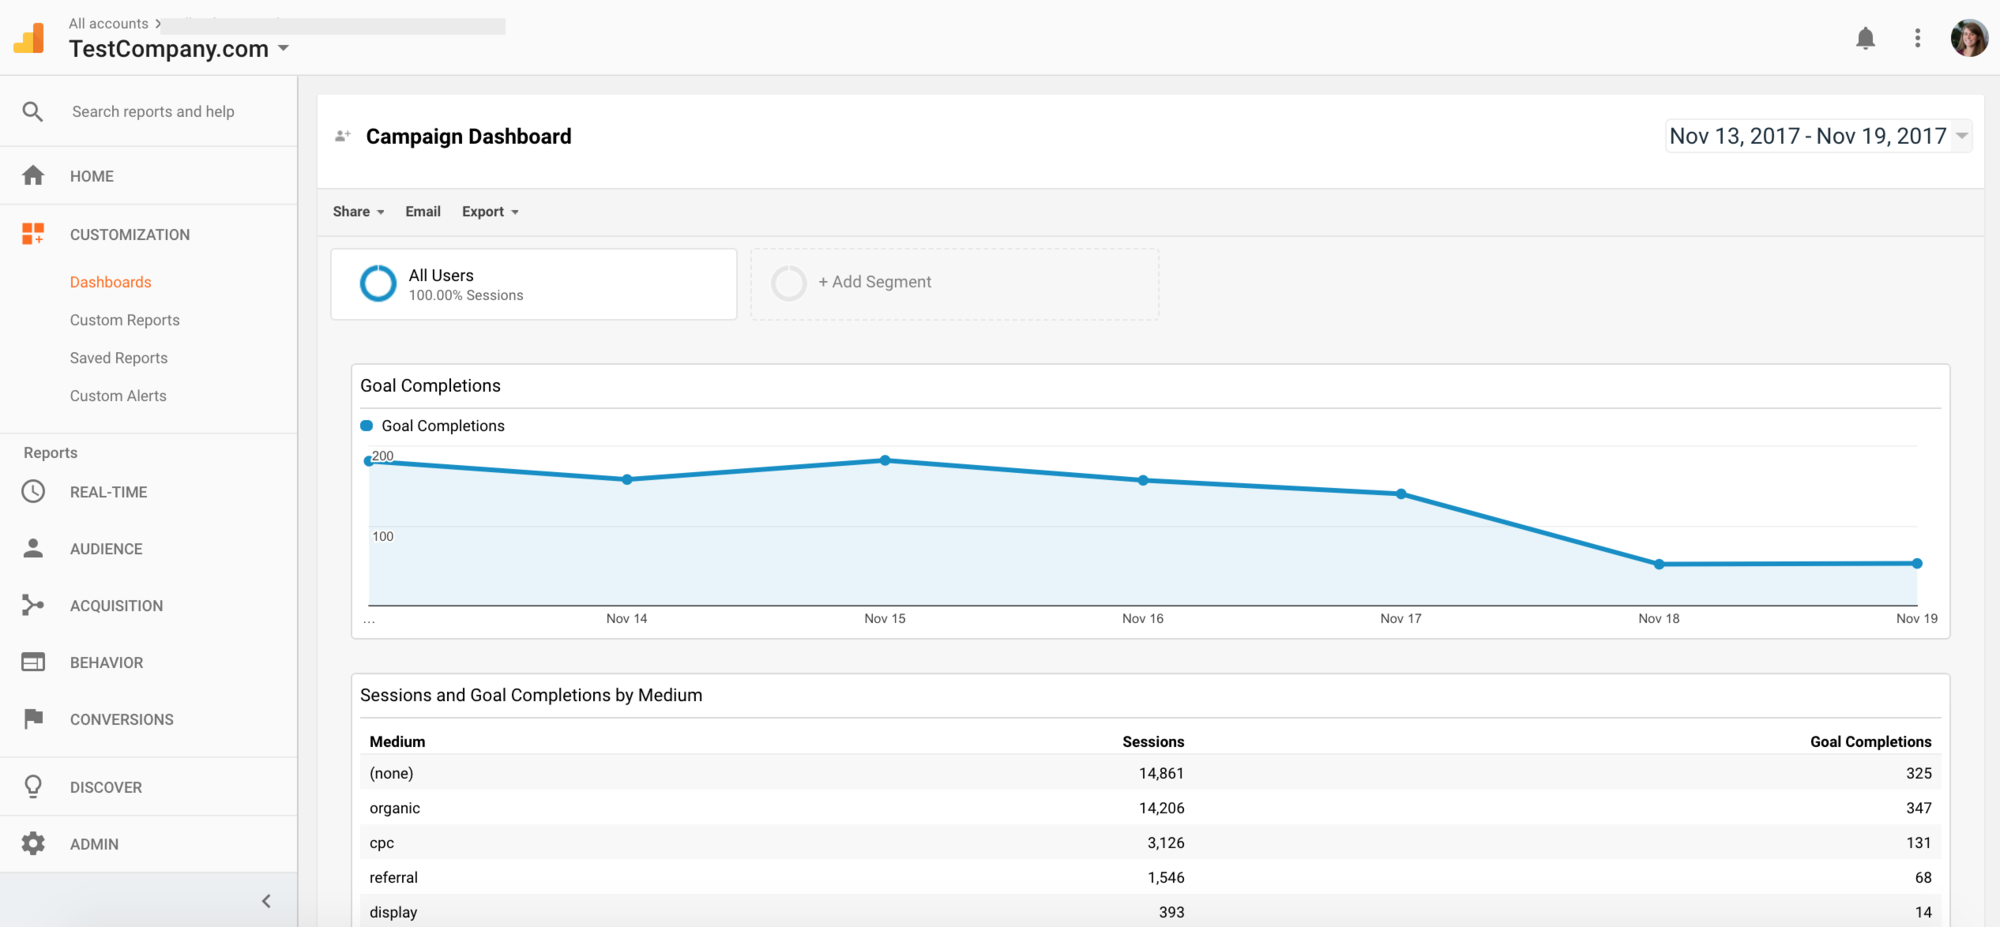
Campaign Performance Report
Within Google Analytics, “campaigns” refer to any marketing events you’re currently running or have initiated such as email campaigns, Pay Per Click (PPC) advertising, partnership marketing, etc. Understanding of each of these efforts performed is extremely important to improving your marketing.
The best way to do that is to create a Campaigns Dashboard inside of Google Analytics. You’ll want to look at bounce rates, goal completions, webpage visits, and behavior flow from each of your campaigns to see what’s working and what’s not. This will help you compare and contrast your different campaigns to look for areas of improvement. In this type of report, phone calls will show up as goal completions. You will need to add call goals to your Google Analytics tracking either through Google call reporting or an external call tracking software, such as CallRail.
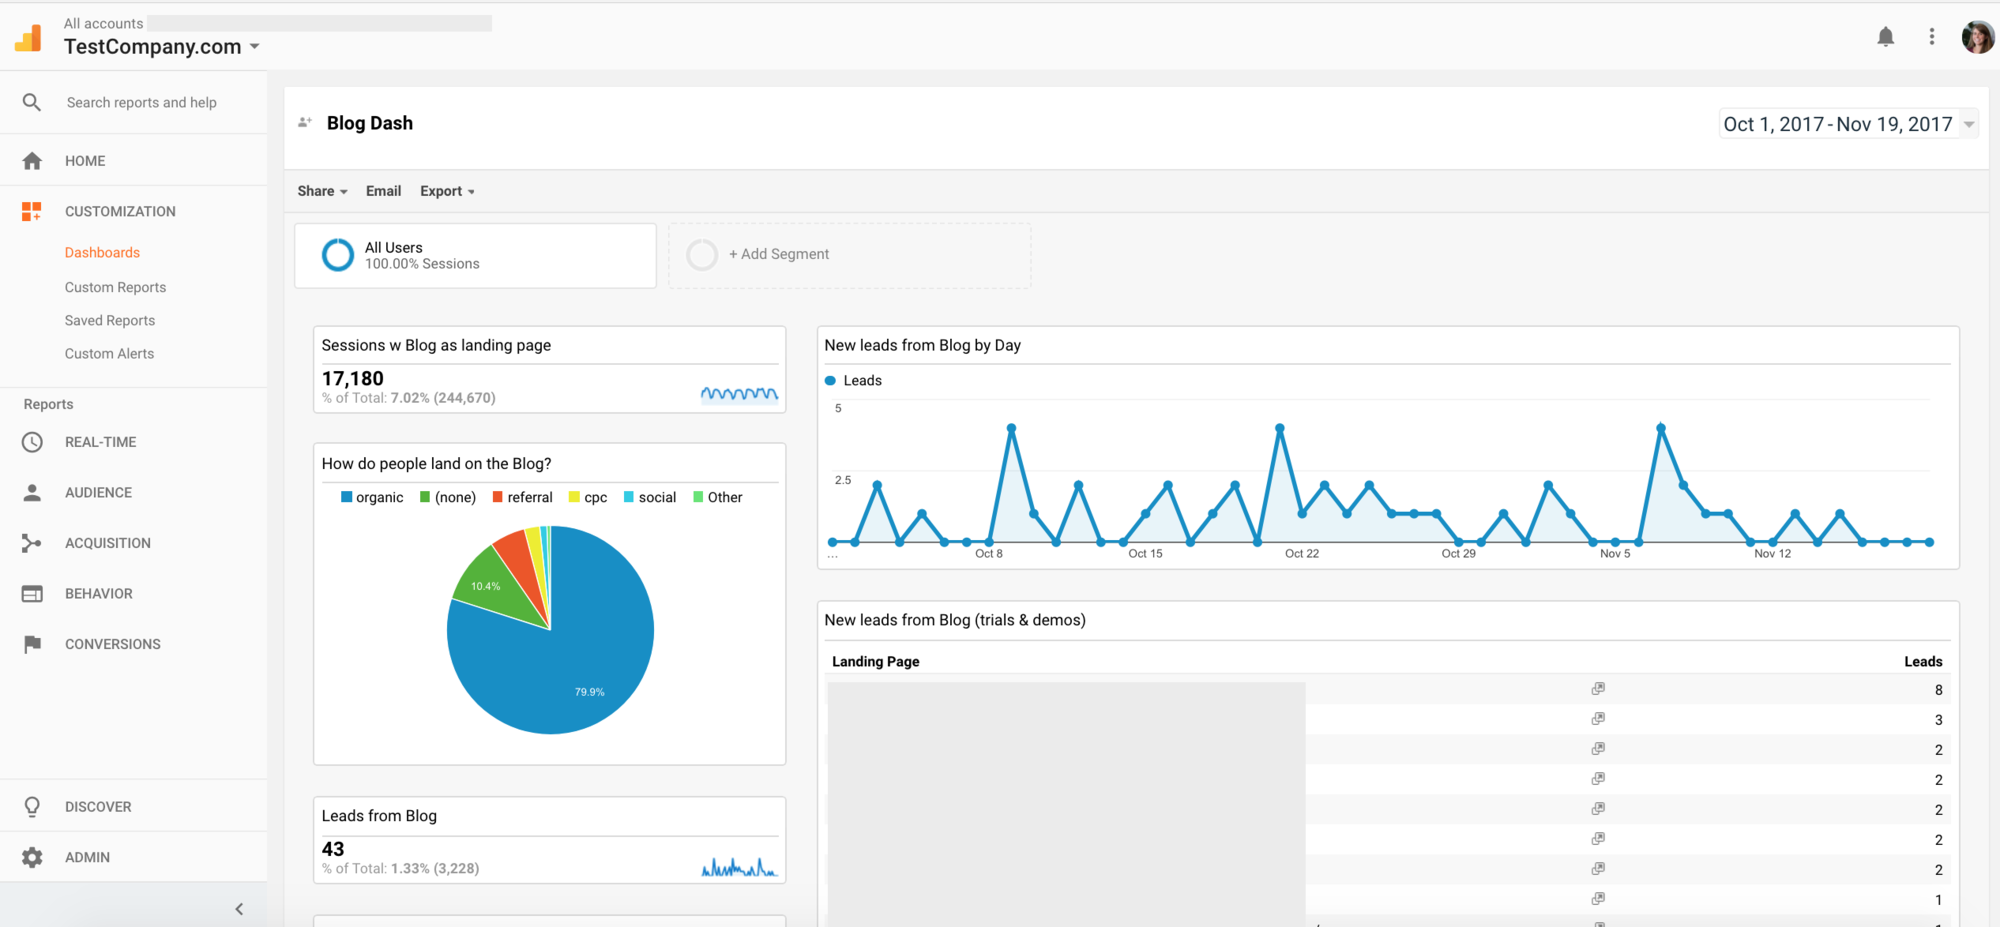
Content Marketing Dashboard
If you’re producing a lot of content marketing, be it blog posts, eBooks, or more, a content marketing dashboard inside of Google Analytics or Google Data Studio will be crucial to your success. You may want to create a blog dashboard that breaks down conversions by post or author, overall leads coming from the blog, as well as the originating marketing source of visitors to the blog.
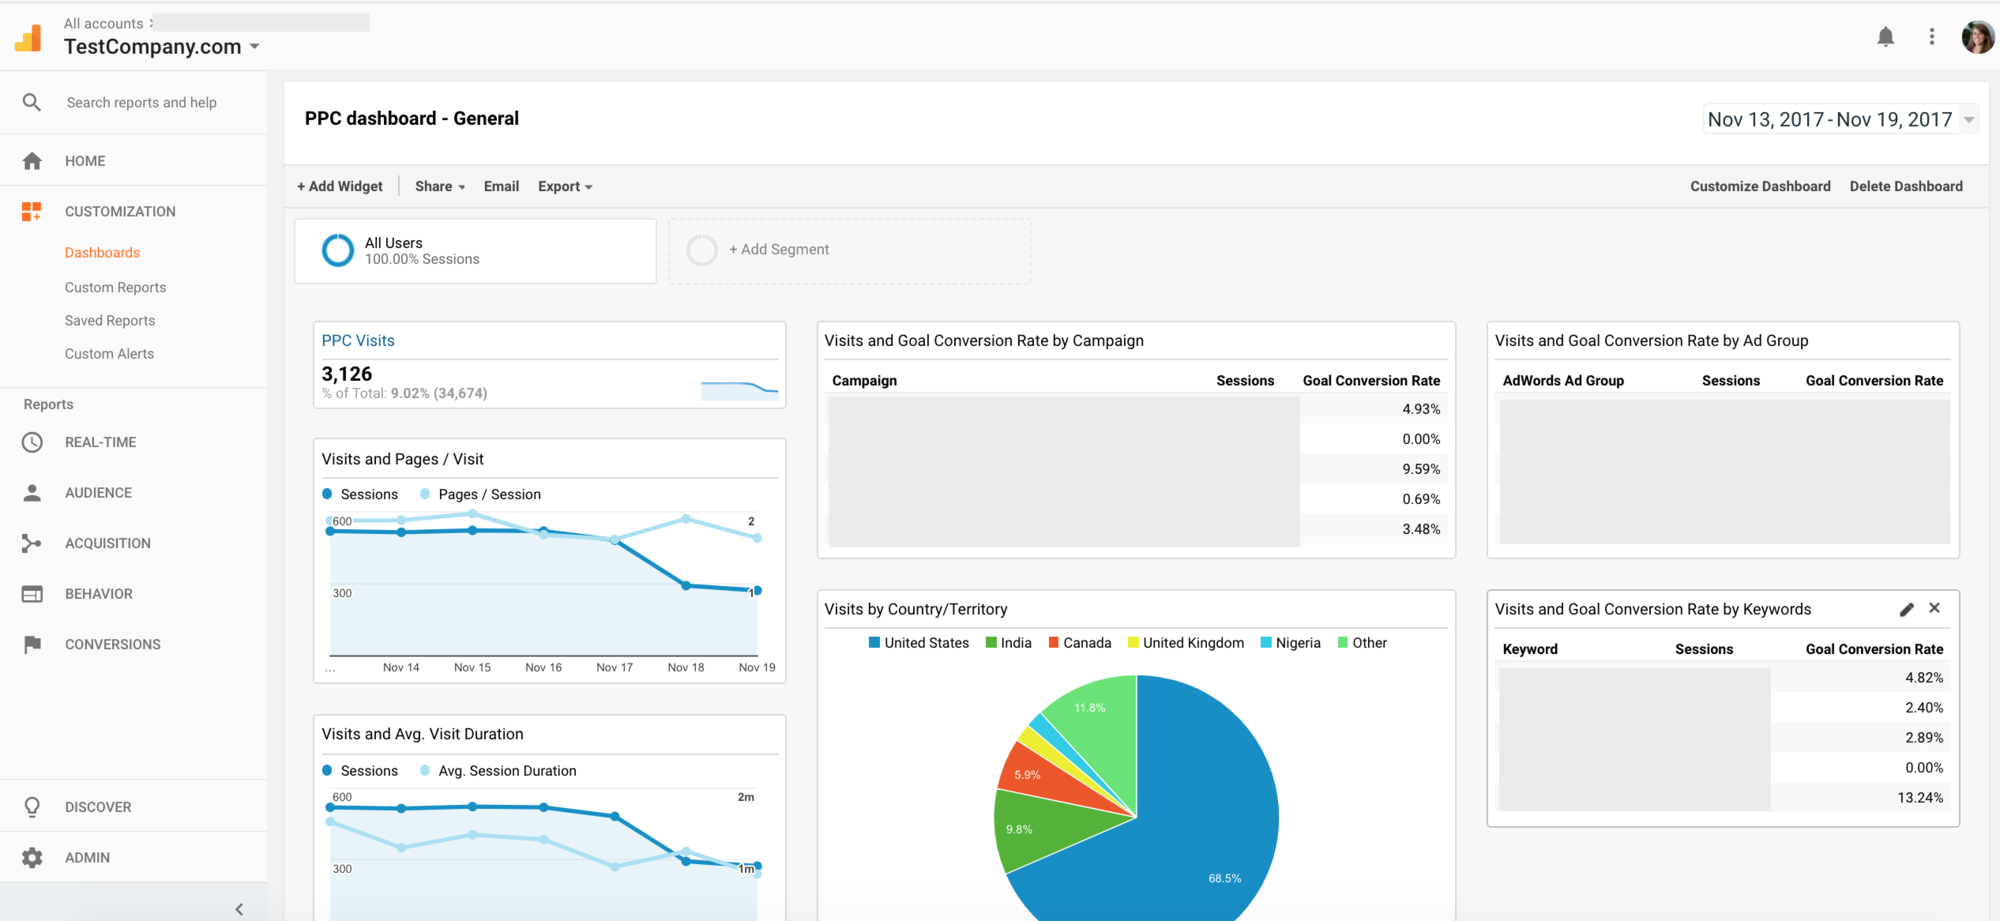
PPC Dashboard
If you’re spending valuable marketing dollars on PPC advertising, you want to know what’s working and what’s not. Create a PPC dashboard inside of Google Analytics or Google Data Studio to track which campaigns, ad groups, and keywords are driving the most leads to your business. You can add phone call data to these reports, including data from mobile click-to-call ads.
Phone Call Dashboard
If phone calls are an important inbound lead source for your business, you’ll want a phone call dashboard in Google Analytics or Google Data Studio to track these valuable leads. It’s important to understand where your inbound phone calls are coming from, as well as the quality of these calls and how they’re converting into customers. Tracking phone calls is one of the most overlooked metrics for websites. You can track google ads performance by pulling in calls by keywords, or create custom metrics that look at things like your qualified call rate. Every Google Data Studio phone call dashboard should include the following metrics:
- Calls by Source: Most valuable thing you can do with your phone call data is understand where the callers are coming from. Track which calls are coming from Facebook, Google My Business, Google Ads, organic search, or offline sources such as billboards or flyers.
- Total Calls: This is particularly helpful when analyzing calls over a certain time period. Comparing call volume week-over-week, or month-over-month can help you optimize your lead strategy and track your progress.
- Average Duration: Long phone calls are always better than shorter calls. It means the caller is more interested in buying your product or service, and needs more information to make the purchase.
- Missed Calls: Similar to total call volume, this metric is important to track over time. Ideally, your missed call percentage continues to go down as you start to improve your team’s phone call handling.
- First Time Callers: While repeat customers are always great, tracking first time callers can help you understand how your marketing is performing at drive net-new leads to your business. Think of first-time callers as customers that would have never discovered your business if not for your marketing efforts.
- Qualified Calls: Your calls are only worth tracking if they’re valuable leads for your business. Call tracking software can help you automatically qualify good leads for your business, and it’s important to track how that percentage improves over time.

How to Create a Phone Call Dashboard in Google Analytics or Google Data Studio
To create a phone call dashboard inside of either Google Analytics or Google Data Studio, you will either need to be tracking phone calls using Google’s call conversion tracking or using an external tool such as CallRail. If you’re not already tracking phone calls, read more about why you should be. Many business owners and marketers overlook the fact that their websites are generating phone call leads from their online marketing efforts, which can lead to poor decision making.
Tracking Phone Calls in Google Analytics
If you are using an external call tracking tool such as CallRail, you will first need to link your call tracking account to your Google Analytics account. Once that is complete, you will then need to create two separate phone call goals:
- Standard phone call goal that tracks every caller
- First time caller goal that only tracks first time callers
You need these two seperate phone call goals so you can compare and contrast what types of calls you are generating for your business.
Once you have set up phone calls as goals in Google Analytics, they will become available in all of your reports through the goals column. For more detailed reporting and analysis, you should create custom reports. Inside of the Custom Report creator in Google Analytics, select your phone call goal as your metric type and drilldown by any metrics you would like such as source/medium or even Google Ads campaigns.
Some call tracking software allows you to import custom values for each phone call, or a blanketed value can be set when you create your phone call goal. This is important because you can create custom reports inside of Google Analytics that allow you track the ROI of your marketing by analyzing the overall opportunity driven to your business with phone calls.
Creating a Phone Call Dashboard in Google Data Studio
The best way to create phone call dashboards in Google Data Studio is to utilize Google Data Studio Data Connectors to push phone call data directly into your Google Data Studio dashboards.
First, you will need to add your new Data Sources to Google Data Studio. By default, CallRail has three Data Sources for you to choose from:
- Calls Summary
- Forms Summary
- Calls Time Series
If you are not using a call tracking software with a native Google Data Studio Connector, you can always add your Google Analytics data as a Data Source. This will allow you to report on the previously created goal conversions for use in your dashboard.
Once you add a new Data Source, you can always customize the dimensions. As mentioned previously, customization is the key to creating the best reports for your business. So don’t be afraid to add a new Field or Parameter to your Data Source for more useful reporting. For example, I typically add a “Missed Call Rate” which is the number of missed calls divided by the total number of calls as I find the percentage view more helpful.
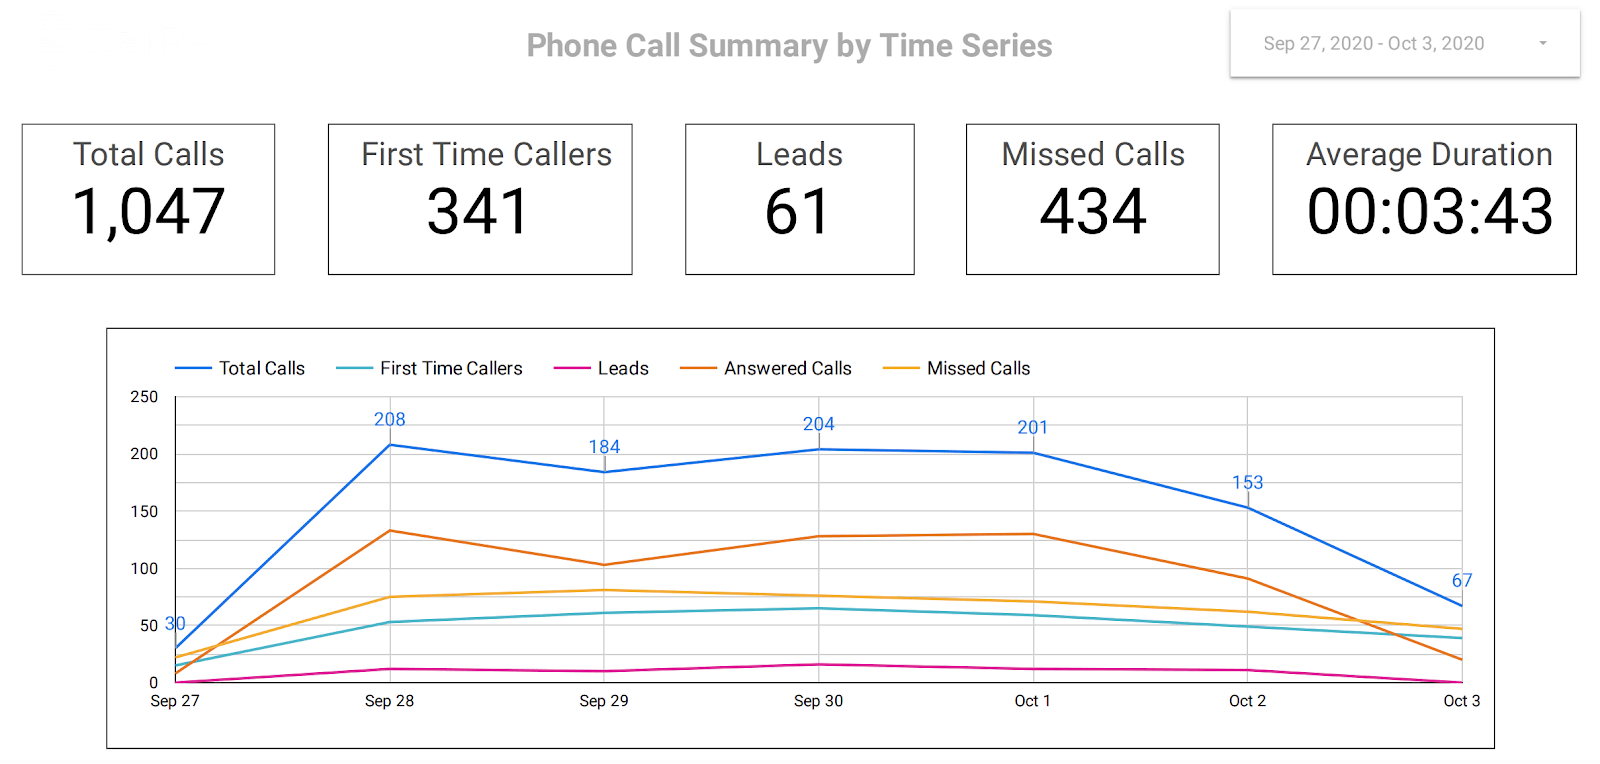
Once you have customized your call tracking data source, it’s time to start building your dashboard. Google Data Studio allows for extremely visually appealing dashboards such as this view of call volume by call duration:
With so many different ways to display the data available, it can become a bit overwhelming but I always recommend keeping it simple. You can choose to display your data in the following formats:
- Time series: Compare calls over different time periods, or just view overall call volume by day, week, or month.
- Bar chart: Best for viewing calls by source. Our standard call dashboard uses a bar chart to compare call quality by marketing source.
- Pie chart: similar to a bar chart, but more useful when comparing a single metric.
- Table: Most valuable when trying to look at more granular information such as top PPC keywords that drive phone calls, detailed call log including caller names and locations, or top landing pages driving phone calls.
- Scorecard: This is what you should use for your most high-level metrics. In the example above we are using scorecards to show counts of total calls, missed calls, first time callers, leads or qualified calls, as well as the average phone call duration.
So now that you’ve integrated your call tracking metrics into Google Data Studio and built a report, how will you keep your reports up-to-date? That’s the best part of using pre-built connectors or integrating with Google Analytics - your data automatically stays up-to-date and relevant through real-time data sharing. No more having to export data and update spreadsheets every time you want to view a report.
Google Analytics and Google Data Studio Dashboards can be a great tool to keep your marketing focused and to have a better understanding of what is actually happening on your website. Integrating inbound phone calls into these dashboards will help you get the right data from your website, and successfully improve your marketing efforts.
Learn more about how call analytics can improve your marketing dashboards. Request your no obligation demo of CallRail, or go ahead and start your 14 Day Free Trial, no credit card needed.


